7 Ways To Interpret An Electrocardiogram (ECG)
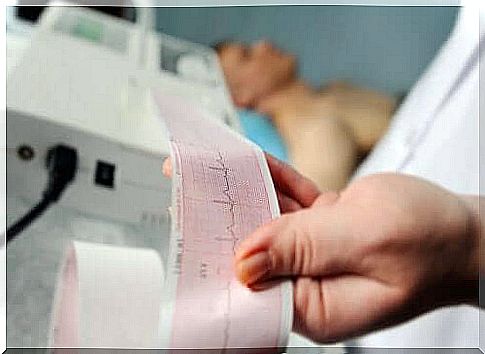
An electrocardiogram, or EKG, is one of the most commonly used tests, especially in emergency rooms and internal medicine. The correct interpretation is in many cases decisive. Even though it is a very common test, its interpretation is not as simple as it seems at first glance.
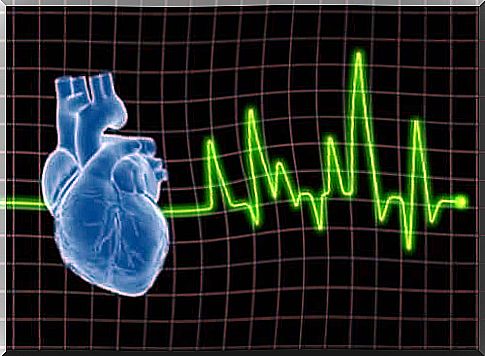
The electrical signals from the heart are recorded by the electrocardiogram. Each heartbeat sends out an electrical signal that is recorded by the EKG. Therefore , the test allows doctors to visualize heart activity and detect possible changes.
In itself, an electrocardiogram is just a linear representation. It shows a chart that a cardiologist must interpret. To do this, he or she must follow a series of steps that we will describe below.
What should you consider when analyzing an electrocardiogram?
1. Check reliability
The first thing we need to do is check that the electrocardiogram is correct. The ECG should have a speed of 25 mm/s and an amplitude of 1 mV per 10 mm. If an error is suspected, the test should be repeated.
If everything is in order, one proceeds to the next step to correctly interpret the data and values that can be read in the result.
2. Calculate the data of the heart of the person concerned

Heart rate is one of the most important pieces of information in the diagnosis of health problems and is the most important piece of information to get from an electrocardiogram. Some EKGs calculate it automatically. If not, there are some manual methods to do it.
Essentially, heart rate is the number of times a heart contracts to pump blood to the rest of the body. This can determine whether there is tachycardia or bradycardia, which are important conditions for detecting possible abnormalities and problems.
3. Heart rate evaluation
The heart rate is the sequence of systoles and diastoles in the muscle mass of the heart. When the organ is functioning normally, it should have about 70 to 75 contractions per minute. In an electrocardiogram, this is shown in the QRS complexes.
This is one of the easiest data to observe. It also allows doctors to determine whether the heartbeat is regular or irregular.
4. Establishing the electrical heart axis

One can assess diseases such as arrhythmias by observing the electrical heart axis. This is one of the most difficult steps in the interpretation of an electrocardiogram.
The electrical heart axis corresponds to the direction the electrical stimulus follows as it passes through the ventricles. These data provide information about possible intraventricular conduction disturbances.
5. The ST segment assessment of an electrocardiogram
The QRS complex is the sum of the electrical discharges of all the cells of the chambers. The T wave then represents the repolarization or electrical recovery of the ventricles of the heart. The distance between the QRS complex and the T wave is what is called the ST segment.
Sometimes the ST segment will go up or down, but if these values are not significant then it is most likely normal. However, if the values exceed the minimum range, the presence of ischemic heart disease is very likely.
6. The assessment of waves and intervals
The intervals between the waves are of great importance in the diagnosis of any type of cardiovascular disease. It is also important to perform an analysis of each of the waves and intervals that have not been assessed.
The PR interval and the QT interval are especially important. When the PR interval is short, it means that there is accelerated atrioventricular conduction. However, when it’s long, it means it’s slowed down.
The QT interval represents the duration of ventricular electrical systole. In addition, it also includes the ST portion and the T wave. It is also closely related to the heart rate. For this reason, when the heart rate is fast, the intervals decrease, and vice versa.
7. Schematic Synthesis
Finally, these are the steps to follow when a physician interprets an electrocardiogram schematically:
- first determine the patient’s heart rate.
- then set the heart rate.
- then define the center axis.
- identify the sinus rhythm (presence of Q waves for each QRS complex).
- then examine the PR interval.
- after that you need to assess the QT interval.
- also evaluate the QSR complexes.
- then analyze the ST part.
- finally evaluate the T waves.
Once all these steps are done, an EKG can identify most problems. Then, from there, doctors can determine the course to take and what decisions a person should make regarding treatment.